
1. Aim of Webpage Debugigng
Activating webpage debugging on a SiteKiosk Online client enables you to identify problems and bugs within the webpages being used by running SiteKiosk Online clients.
2. Setup
The following example of activating webpage debugging only works with SiteKiosk Online on clients with Windows 10 or higher.
Before beginning, make sure SiteKiosk Online is activated on your client. Also, ensure that you are logged into your SiteKiosk Online account and have opened the desired project to activate webpage debugging.
3. Elementary Adjustments
For the given example, the template browser is utilized, and start URL is already incorporated into the webpage element.
To begin, two entries need to be added in the advanced settings:
The first entry enables the display of the DebugWindow within the web element on the client:
1. Click on the Settings-button, then select Advanced, and click on the green Add setting-button.
2. Enter debug.showDebugWindow under Path and enable the checkbox next to Value.
3. Finally, click on Save. The Window will close, and the advanced setting will be listed in the overview.
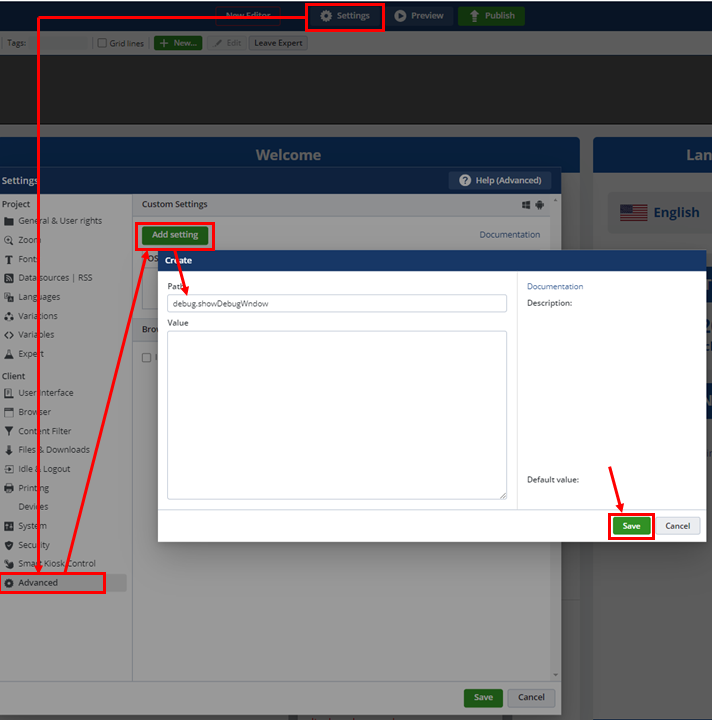
Fig.1 – Activation of the debug window display
The second entry enables the Advanced Options in the debugged window:
1. Click again on the green Add setting-button
2. enter debug.showAdvancedOptionsInDebugWindow into the text field.
3. Enable the checkbox under Value again
4. Finally, press Save
Both settings are now listedin the overview.
Press Save in the bottom right corner to save and close the advanced settings.
Now, proceed to publish your SiteKiosk Online Project on the client.
4. Effects on SiteKiosk Clients
For the next steps, the DevTools in the debugged window are necessary.
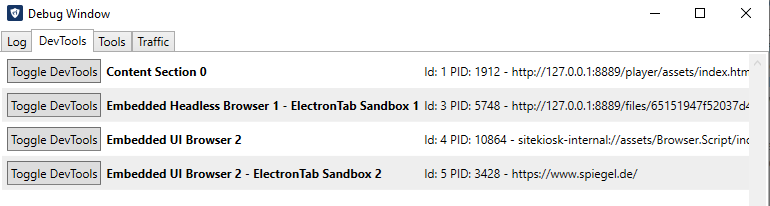
Fig.2 – DevTools in the debug window
1. Open the DevTools tab in the debug window by pressing F12.
2. Click on the Embedded UI Browser-button to open the DevTools window.
3. In the Developer Tools, select the Console-tab to analyze possible failures in the webpage.
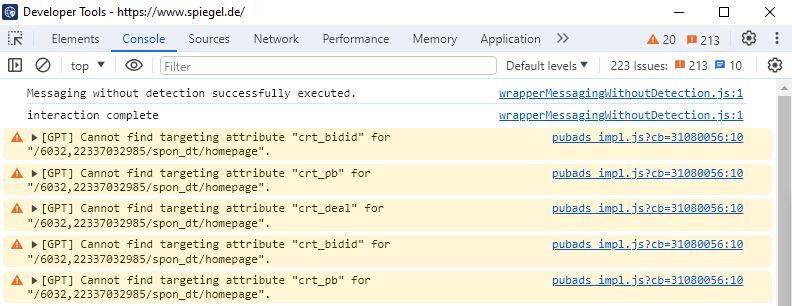
Fig.3 – Console tab
This overview displays errors and bugs present in the webpage used for the SiteKiosk Online project.